• About us
en
ites
  • Plant Design Software
    • ESAPRO Suite
      • Process Design
      • Plant Design
      • Electrical Design
      • Add-ons
    • Resold Products
  • Training and Support
  • Case histories
  • About us
  • News
    • All
    • News
    • Magazine
  • Contact
    • Contact us
    • Request Demo
    • Work with us
Request Demo
Magazine

What is and how to create the P&ID (Piping and Instrumentation Diagram)

Posted on 26 January 2023
Francesco Pais

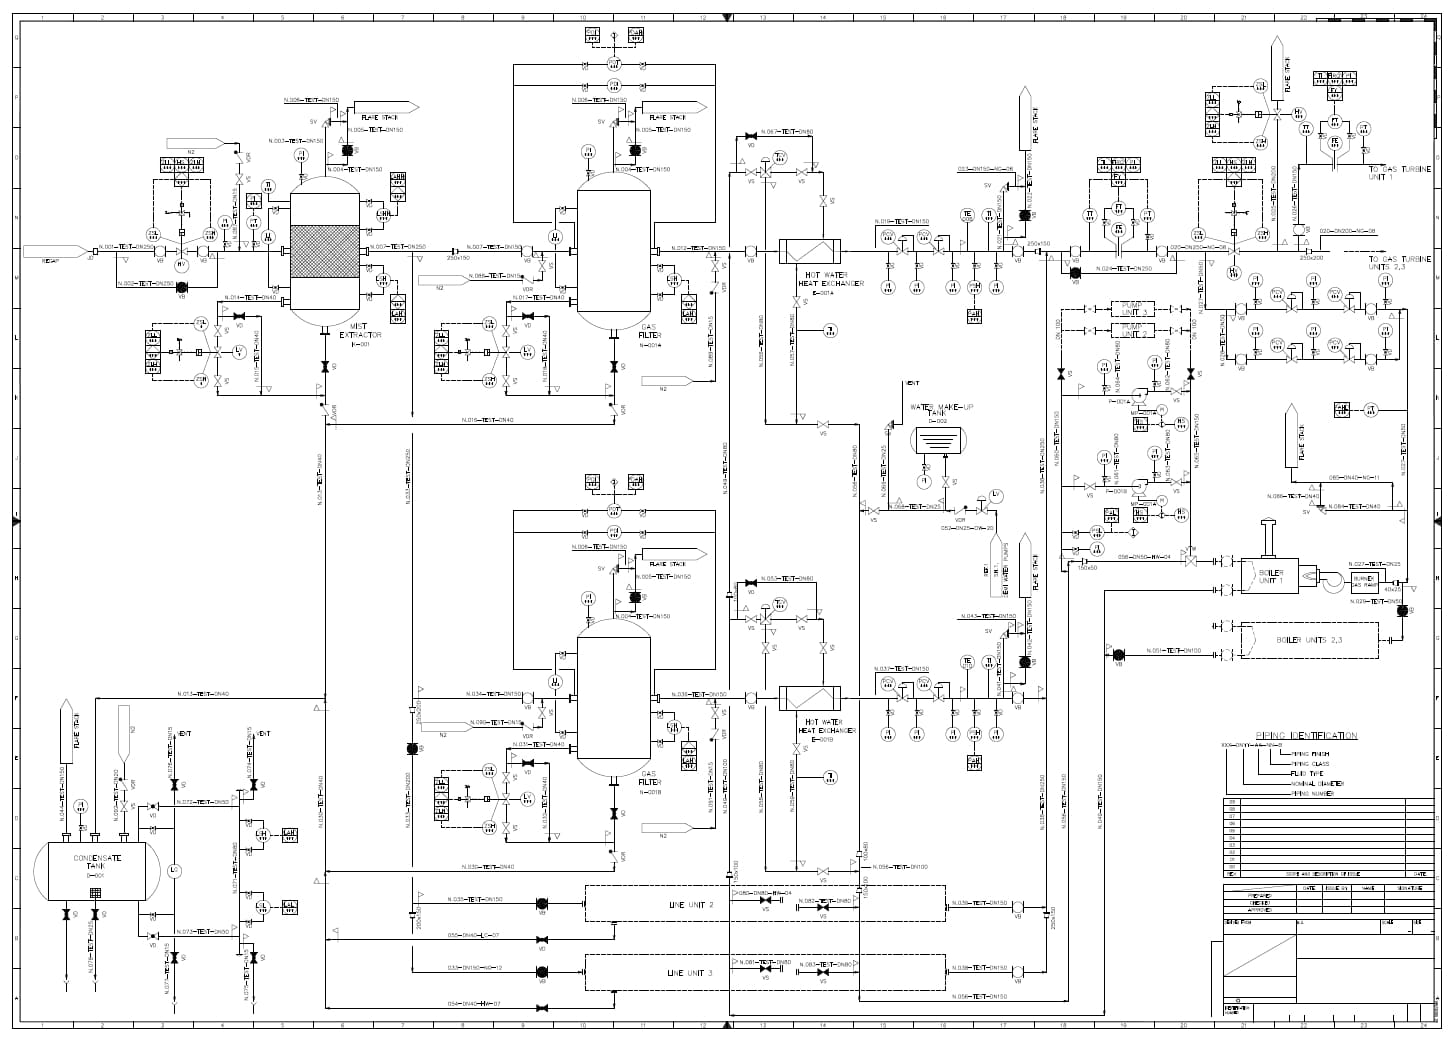
The design of an industrial plant is based on a multidisciplinary approach: this makes it necessary to use an initial technical document that provides a complete overview of the work, preparatory to the subsequent design phases. The information necessary for the design of the plant must be contained within the P&ID, an acronym for Piping and Instrumentation Diagram, a technical drawing in which it is possible to view all the interconnections between the equipment, the size of the pipes, the material specifications, and all other information necessary for the construction and subsequent maintenance of the plant.

To plan the construction of an industrial plant, it is necessary to interact between the various disciplines involved: only in this way will it be possible to realize the initial idea provided by the client and analyze in detail the main aspects of the project, from the necessary components to the costs and time required for construction. The complexity of the interactions between the pipes of an industrial plant, its equipment, and the need to represent the entire structure of the plant and control systems through a conceptual diagram, make an in-depth study of the project necessary.
Designing a P&ID?

ESAPRO P&ID includes ready-to-use ISO/ANSI symbol libraries and automatically generates line lists, valve lists and the instrument index.

Discover ESAPRO P&ID

The complexity of plant design has made it necessary to use a process diagram, the P&ID, which allows the equipment and machinery present in a plant to be understood and graphically represented. A working methodology that, not by chance, is in line with the BIM (Building Information Modeling) approach, the digital representation of a project that allows the entire life cycle of a plant to be managed: the P&ID diagram corresponds to LOD 200 of a BIM project.

Each element must be analyzed in detail, and all the necessary information must be available to correctly illustrate the processes and define the components used.

Let’s find out together the P&ID meaning and its main uses during the design of an industrial plant.


What is the P&ID diagram and what is it for

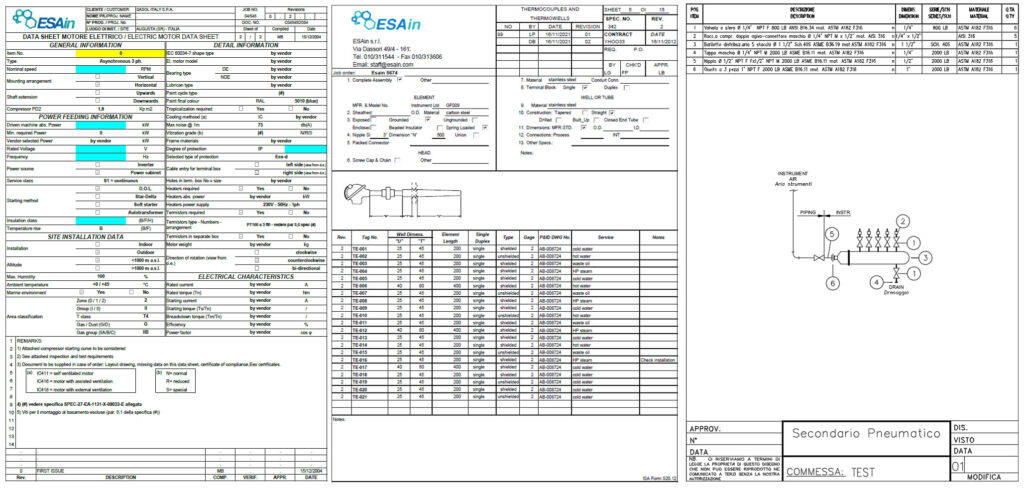
We can define the P and ID as the process diagram that allows us to study the operation of a plant: it is the main document that aims to represent the complexity of an industrial project and from which it will be possible to extract the technical sheets (DataSheet) and the assembly drawings (Hook-Up), the detailed plans for the connection and configuration of the plant elements.

The Piping and Instrumentation Diagram is also the basis for the subsequent study of the piping route, which allows for a 3D representation from which it will also be possible to extract the isometric sketches, the documents sent to the workshop responsible for the production of the lines.

The Piping and Instrumentation Diagram is also used to create the automation electrical diagrams: the information contained in this document will provide the necessary inputs to the designers who deal with the instrumental and electrical parts. The latter will be able to define in detail the automation electrical diagram necessary to manage all the power signals of the plant.

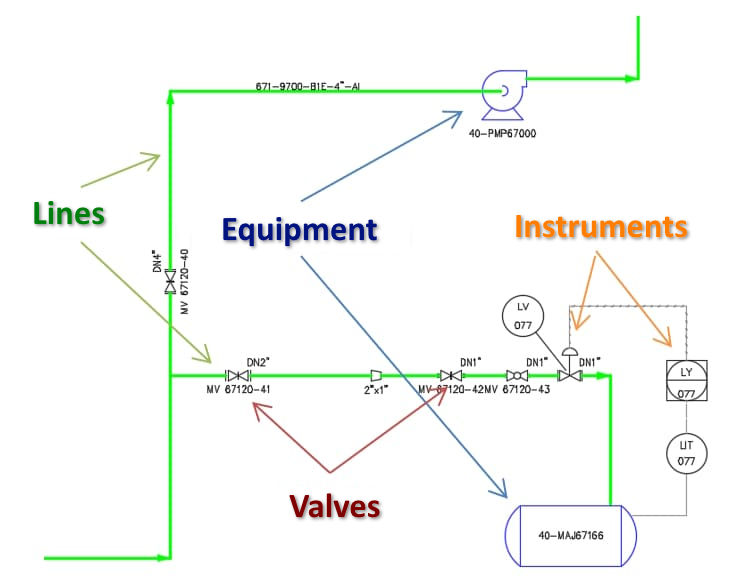
This process diagram allows the representation of the connections between each element of the plant and graphically represents the relative position of the flow control components, equipment, and all project instruments. The document provides engineers and technicians with a detailed guide and uses standardized language, with which it is possible to define and represent each individual component: from instruments to valves, to equipment.

.

From symbols to project, without redoing everything by hand

ESAPRO P&ID starts from the standard symbology you are reading and connects it to the plant data.

  • Ready-to-use ISO/ANSI symbol libraries
  • Automatic line list, valve list and instrument index
  • Revision management and tracked changes
Discover ESAPRO P&ID
plan work for isolate

How to create the P&ID

.

The instrumentation diagram P&iID is preparatory to the subsequent design phases, including the physical layout of the plant: it must therefore contain all the necessary information that allows the subsequent three-dimensional representation of the pipes, supports, connections, structural elements, and every other element.

To create the P&ID, it is necessary to use plant design software, such as ESAIN’s P&ID software, which allows the graphic drafting of the process diagram quickly and without errors: automatically providing lists of lines, valves, and instruments.

In practice, these lists become some of the most useful deliverables during revisions: the P&ID line list (Line List), together with the Valve List and Instrument Index, helps maintain consistency between the diagram and the subsequent phases (piping and instrumentation) and reduces recalculations and manual checks after a change. To see which fields to include, how to read line numbers, and how to manage the lists between Rev A and Rev B, we’ve put together a dedicated guide: P&ID line list.

Using P&ID software, it will be possible to integrate the graphic representation of the plant with the correct data management. Additionally, it simplifies the plant drawing by using functionalities that allow automatic labeling of lines and components. As the project grows, however, the value of the software is not only about drawing speed: what becomes critical is how data, revisions, and lists are managed. This is why it is important to understand the difference between AutoCAD P&ID and an intelligent P&ID tool in real-world design workflows.

To create the P&ID of an industrial plant, it is necessary to respect the symbols provided by the regulations in the field (ISA or KKS): this will allow easy management of the naming of lines (including valves and components), control instruments, and equipment. The nomenclature used during the creation of the Piping and Instrumentation Diagram allows each element to be identified by a combination of letters, the first of which represents a process variable (for example: the letter “P” for pressure, “T” for temperature, the letter “L” for level).

The subsequent letters, on the other hand, identify the component in detail, indicating its function within the industrial plant. Examples include the letter “A“, which indicates an alarm, “D” which indicates a difference or differential, such as a pressure indicator, the letter “T” for the transmitter function, and the letter “S” for the switch function.

To create the Piping and Instrumentation Diagram, it is therefore necessary to become familiar with the process diagram symbols used to define each element of the plant: from equipment (such as motors, fans, turbines) to pipes and their connections, to vessels used for fluid storage, pumps, valves, and heat exchangers.

Do you want to know the software for producing P&ID diagram?

One of our consultants will provide you with the information you need.

Contact us

Similar posts

Best P&ID software with structured project data, native DWG, automatic lists, spec-driven design and revision control

Best P&ID Software: Key Criteria for Choosing the Right One

PIMM Plant Information Modeling & Management as a connection between BIM and the industrial Digital Twin

PIMM: Plant Information Modeling & Management for Industrial Plants

P&ID and 3D piping model representing the same industrial plant from complementary perspectives

Single Source of Truth for P&ID and 3D Piping: Reducing Rework and Data Silos

The ESAPRO suite

Software for industrial plant design. 800+ clients and 4,000+ installations worldwide.

Discover the ESAPRO suite

Latest articles

See you at Ecomondo 2026

4 weeks ago

ESAPRO moves to the cloud: simpler, more flexible licensing

4 weeks ago

Summer office closure

2 months ago

Categories

News 17
Magazine 47
Logo-Esain-Anniversary-white

About us

Since 1994, ESAIN has developed integrated software for industrial plant design. The ESAPRO suite covers P&ID, 3D piping modelling and electrical design, with over 800 clients and 4,000 installations worldwide.

The Company has benefited from the resources of the PR FESR LIGURIA 2021-2027, Bando Digitalizzazione 1.2.3

Coesione_Italia_Liguria

Products

  • ESAPRO P&ID Software
  • ESAPRO 3D Piping Software
  • ESAPRO Cable Trays Software
  • Add-ons
  • Resold products

Services

  • Training and support

News

See you at Ecomondo 2026

4 weeks ago

ESAPRO moves to the cloud: simpler, more flexible licensing

4 weeks ago

Summer office closure

2 months ago

Case history

  • All case histories

Follow us

LinkedIn
YouTube

ESAIN s.r.l. · +39 010311544 · info@esain.it · Via de Marini 1, WTC 8th floor – 16149 Genoa, Italy

Share capital € 50,000 · REA GE-347489 · P. IVA 03470480108

  • Privacy
  • Cookie